Digital Sensitometry
part I
by Henri Gaud
I unveil here a few tests I made recently in order to better understand
the sensitometric response of a silicon photographic image sensor.
This is not a scientific demonstration, simply an example of what we
can understand about how digital image sensors work.
The sensor is Canon's 1 Ds MkII sensor; as a starting point we'll focus
on the characteristic input/output curves. In a future article, examples
of images will be presented.
Note : this test is not influenced by flare, thanks to a simple trick,
so no flare here.
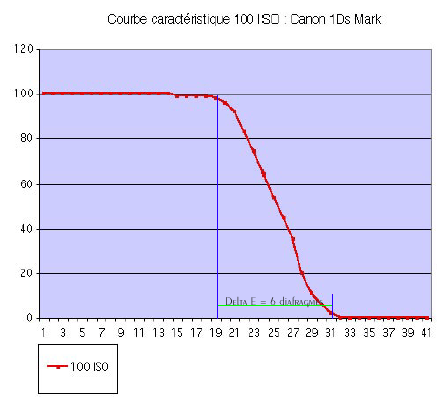
Characteristic curve ISO 100, canon 1Ds Mk II
Admissible tonal range Delta E = 6 f-stops
Characteristic curve of the sensor plotted from an input file in RAW
format, namely the new Canon format RAW.CR2. The file has been opened as
a 16-bit file and converted to the LAB format. What we are interested
in, is to know whether our detector meets our expectations ; values from
0 to 100 are the output and values from 1 to 41 are the input luminance
steps of the subject, in increasing luminance values.
An input reference scale of grey levels was created (like in
conventional photography), with an increment of 0.15 i.e. 1/2 f-stop.
Output values in the digital image file are expressed from 0 to 100 in
units of the LAB file format. My personal choice was to invert those
values in order to get a curve similar to a slide film (vs. a negative,
for which densities increase). The LAB format is a "theoretical" format
so the zero value corresponds to an absolute black allowed by the format
; 100 corresponds to an absolute white. Presented like this, the
characteristic curve is close in shape to a conventional colour slide
film, in terms of film we would qualify this curve as being rather
weakly compensating, similar to a film that would record luminance
values "mechanically" without any contrast compensation.
What can be said about this curve : the maximum admissible luminance
range is easy to read ; on the chart, 12 steps can be read
(corresponding to a total of 12-1/2 clicks), i.e. a range of 6 full
f-stops.
Conclusion : if we compare the sensor to a conventional slide film, we
can say that it can record a tonal range of 6 f-stops. We object that
the curve does not have the proper shape that would please us, no
problem, the 16-bit LAB format allows us to do whatever suits us very
easily by post-processing as long as we did not lose information about
extreme luminance values. In other words, anything outside the tonal
range of 6 f-stops is lost, nothing new with respect to what we know
from a conventional film.
The goal of the test
of course, testing the sensor, the range and shape of the
characteristic curve, the maximum admissible tonal range Delta E i.e.
the maximum luminance range that the sensor can record from a real scene
where large variations of luminances exist.
This test did not take flare into account. In the real world, since
flare tends to reduce the contrast in the optical image, we reasonably
expect that our system is able to record scenes with a luminance range
of about 7 f-stops.
The other goal is to determine what could be the digital equivalent of
the well-known zone-system-like exposures N-2 ; N-1 ; N . N+1 ; N+2 and
what can be done by digital post-processing. Does it make sense to
define this for a digital sensor? does it make sense to expect some
digital contrast management, like we do for film by varying our
developer and processing time?
Possible characteristic curves :
Canon 1Ds Mk II
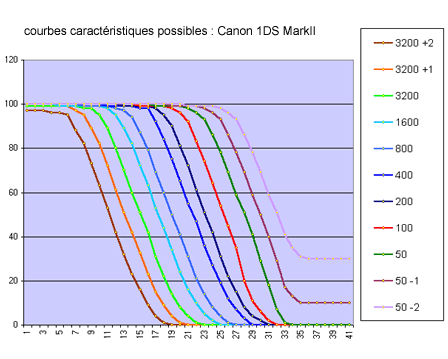
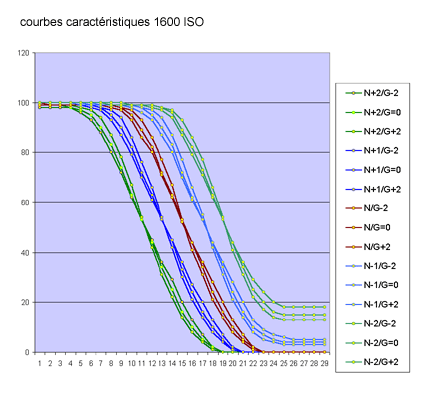
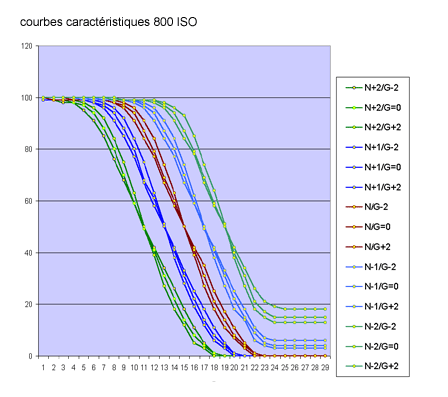
Let us examine what can be done. Same sensor but 5 possibilities of
post-processing : N-2 ; N-1 ; N . N+1 ; N+2 and a wide range of
equivalent ISO sensitivities. The standard ISO range goes from ISO 100
to ISO 1600, plus 50 and 3200 taking into account corrections by the
Canon RAW file software manager. Doing so we get different curves
parallel to each other. Unlike silver halide films, those digital curves
do not change so much when the ISO setting changes. Extreme curves are
not too bad but the post-processing is very efficient (+1, +2, -1, -2
f-stops). When ISO 50 setting is processed like 25 or 12, eventually
some important 'digital saturation' appears but we have pushed the
system to its limits so we get what we deserve. In more standard
conditions, it is hard to see differences in the curves from one ISO
setting to another. In order to determine the right exposure time, we
have used a 18% grey card for which the output is placed at L=50 just in
between 0 and 100. Slight variations in sensitivity are probably due to
the experimental setup more than due to the camera itself. We would
dream to be able to get such a set of response curves with a single type
of film processed in various developers !
So now we are all set as far as calibration is concerned, we can start
our photographic work in confidence.
Note. Many users complain about the Canon Viewer Utility, but for the 1
Ds II you do not have the choice if you want to keep the advantages of
the RAW format. So we use it because we have to, we admit that it is
very slow but not as bad as the previous one.
For this article I had to process 203 files 15 times each ; one minute
and a half per process with a Mac G4 bi-processor 2x1GHz, altogether 75
hours of machine time...
What is really impressive is the smoothness and regularity of the
curves and the ability of the sensor, with some post-processing, to
record all required image information. A tonal range of 6 f-stops, a
possibility to adjust the ISO setting by 4 f-stops, an additional 2
f-stop scale plus a possibility of +-2 f-stops by post-processing, all
this makes a total allowed tonal range of 9 f-stops (at N+1 and N+2,
increased 'saturation' induces some loss of performance).
The maximum overall performance of this sensor in terms of all
acceptable speed/aperture combinations is 6+9 f-stops. Of course it is
very difficult to properly exploit all values ; however the ability to
record 6 f-stops +4 additional by post-processing is very usable and
will allow to "rescue" many difficult shots, by a combination of N+2 and
N-2 images, for example using a tool like Photoshop®.
Curves at 50 Iso
Additional information
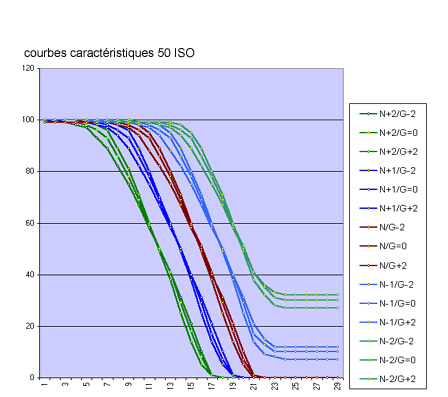
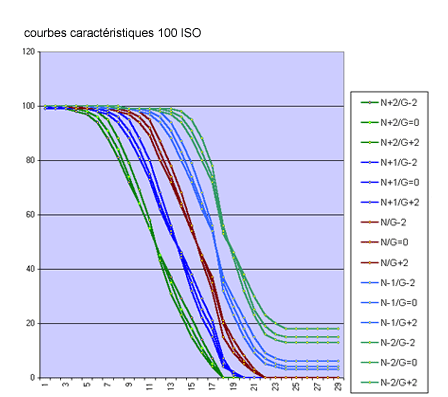
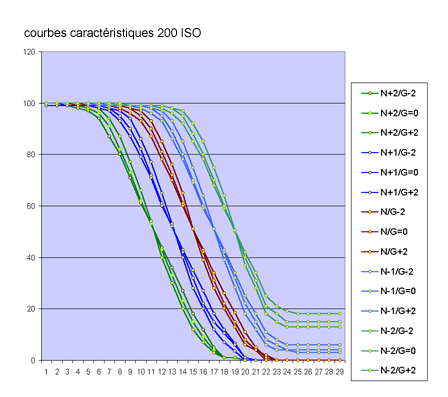
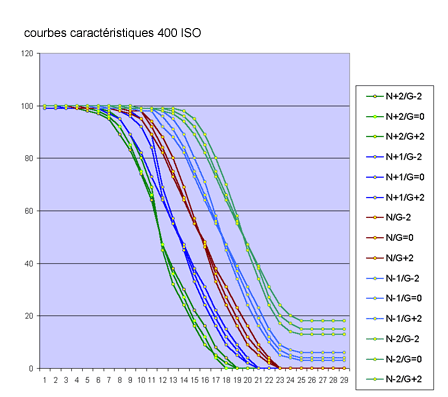
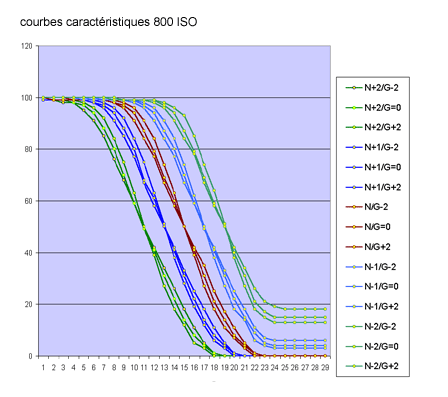
N+2/G-2 = pushed processing N+2 i.e. +2 f-stops ; gain in relative
sensitivity = 4X ; G-2 = correction factor for the gamma contrast factor
gamma-2. The vertical scale is Canon's and is arbitrary but is the same
for all post processing and all ISO settings.
N-2: choice of N-2 post-processing i.e. loss of 2 f-stops in terms of
sensitivity, relative sensitivity divided by 4.
This set of curves represents the whole possibilities of the sensor at
ISO 50 setting. The results are easy to use, the contrast parameter
allows to adjust the compensating effect. But this is not really a
miracle taking into account all the possibilities allowed by a 16-bit
file, the maximum recordable Delta E is still 6 f-stops and does not
change significantly.
The inflexion point is always located at L=50 in the output for the 5
curves and for all sensitivities.
All N+- post-processing are perfect except for N-1 and N-2 where a huge
increase of 'saturation' is visible. To be used for rescue purpose only,
however there is actually recovery of lost data. In principle taking
into account the excellent exposure meter of this kind of camera, it is
hard to be wrong when you have a look at the histogram while taking the
picture. In extreme cases you can even have your laptop with you and
check, simply open the file in 16-bit, examine the 16-bit LAB histogram
with Photoshop®.
It can be seen that pushed post-processing are correct and that N-2
precisely gains 2 f-stops, this degree of precision cannot do any harm,
even if it is difficult in practice to estimate the error you made on
your f-stop setting.
Curves at 100 Iso
Curves at 200 Iso
Curves at 400 Iso
Curves at 800 Iso
Curves at 1600 Iso
Curves at 3200 Iso
Conclusion
From a photographer's point of view, one has hardly ever encountered
such sensitometric curves with film. The expected possibilities are
superb and hard to believe. We have to live with this reality: digital
sensors offer us the moon ;-)
Now we need to complete this lab experiments with some real shots on
real objects in order to check whether some unexpected factors could
occur...
In other words, we can dream to get a perfect image rendition from ISO
12800 to ISO 25 : this is something uncommon, to say the least.
Not so good are the N-1 and N-2 post-processing results. The idea is to
use the sensor at N+1 and N+2 and to post-process at N-1 or N-2, for
example instead of ISO 100, set ISO 50 or ISO 25 and post-process to
rescue the shot. Well this is not a good solution, doing so we get a
terrible increase of 'saturation' and highlights are burned, see the
next article.
However when exposed N-1 or N-2 and post-processed N+1 or N+2, things
should go smoothly, this is what we expect from our curves.
Last conclusion : long life to digital sensors providing such exemplary
sensitometric curves, but the affair has to be followed carefully.
HG - 2005
read also :
digital sensitometry
(part II)
dernière modification de cet article :
2005
|
